Power BI Dashboard Development
Executive and operational dashboards built on a proper semantic model — not a spreadsheet with charts on it. DAX time intelligence, drill-through, bookmarks and automated refresh included.
Data Analyst & BI Developer
From raw data to production AI — BI systems, ML pipelines, and Generative AI built as one connected stack.
Most data professionals specialize in one layer. I build the full stack — from clean, warehouse-ready data through BI dashboards and into production AI. Over the past three years, I've worked with businesses across the UK, USA, Germany, and UAE, delivering Power BI reporting systems, SQL data warehouses, predictive ML models, and Generative AI pipelines built on LangChain and n8n. What makes this rare is the combination itself. BI and Generative AI sit at opposite ends of most data teams — I've built deep expertise in both, and I know how to connect them into a single, coherent data architecture. At Code Prisma, I led BI transformation for a technology company — designing reporting infrastructure used by leadership and clients alike. Through Upwork, I've delivered 45+ projects across BI, data engineering, ML, and Agentic AI for clients who needed more than dashboards: they needed data that works end-to-end. My stack: Power BI, SQL Server, Python, LangChain, n8n, Microsoft Fabric, Snowflake, BigQuery, and every layer of the pipeline in between. The goal is always the same — data that's clean, connected, and actually used.

I'm a BI developer and data engineer based in Islamabad, working remotely with teams across finance, HR, healthcare, hospitality and marketing.
Most of my work starts the same way: a business has data in three or four places that don't agree with each other, and a monthly report someone rebuilds by hand. I connect the sources directly — REST APIs, SQL Server, ERP and CRM systems, Excel drops — land them in Microsoft Fabric or SQL Server, model them into a proper star schema, and build the reporting layer on top in Power BI with a DAX layer that holds up when the numbers get questioned.
The part I care most about is what comes out the other end. A dashboard that says "average wait time: 35 minutes" is fine. One that says "only 40.68% of patients are being seen inside the 30-minute target, and the average is hiding it" is the one that changes how a department is staffed. That's the standard I build to.
Whether you need one dashboard rebuilt or a warehouse designed from scratch.
Executive and operational dashboards built on a proper semantic model — not a spreadsheet with charts on it. DAX time intelligence, drill-through, bookmarks and automated refresh included.
Medallion-architecture warehouses in Microsoft Fabric or SQL Server. Raw ingestion, cleaned layers, and a business-ready star schema with validation at every layer transition.
Fact and dimension modelling that makes reports fast and measures correct. If your Power BI file is slow or your totals do not add up, this is usually why.
T-SQL development, stored procedures, and tuning slow queries across SQL Server, Azure SQL, PostgreSQL and Redshift.
Data transformation scripting, forecasting, churn prediction and NLP sentiment scoring — with the output translated back into reporting a business team can act on.
Agentic n8n workflows that remove recurring manual work: multi-source data collection, LLM-routed reporting, scheduled alerts and API integrations.
Each of these is a real build — the problem, how the data was actually wrangled, and the number it surfaced that nobody could see before.
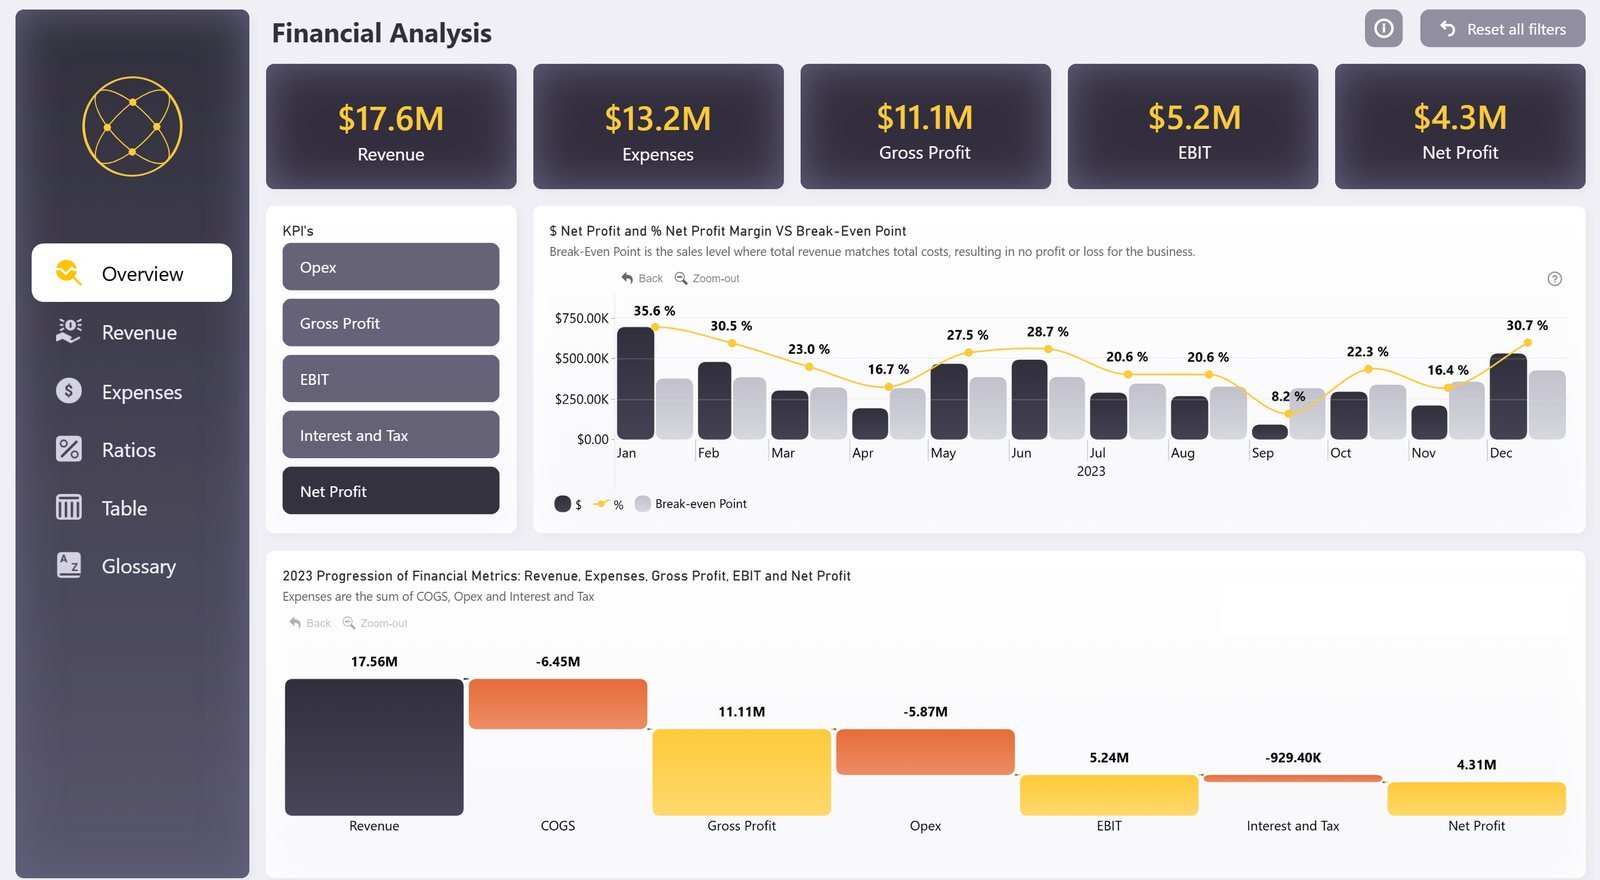
A multi-line consumer goods business (spanning sports equipment, sportswear, and nutrition supplements) had no consolidated way to see how the company…
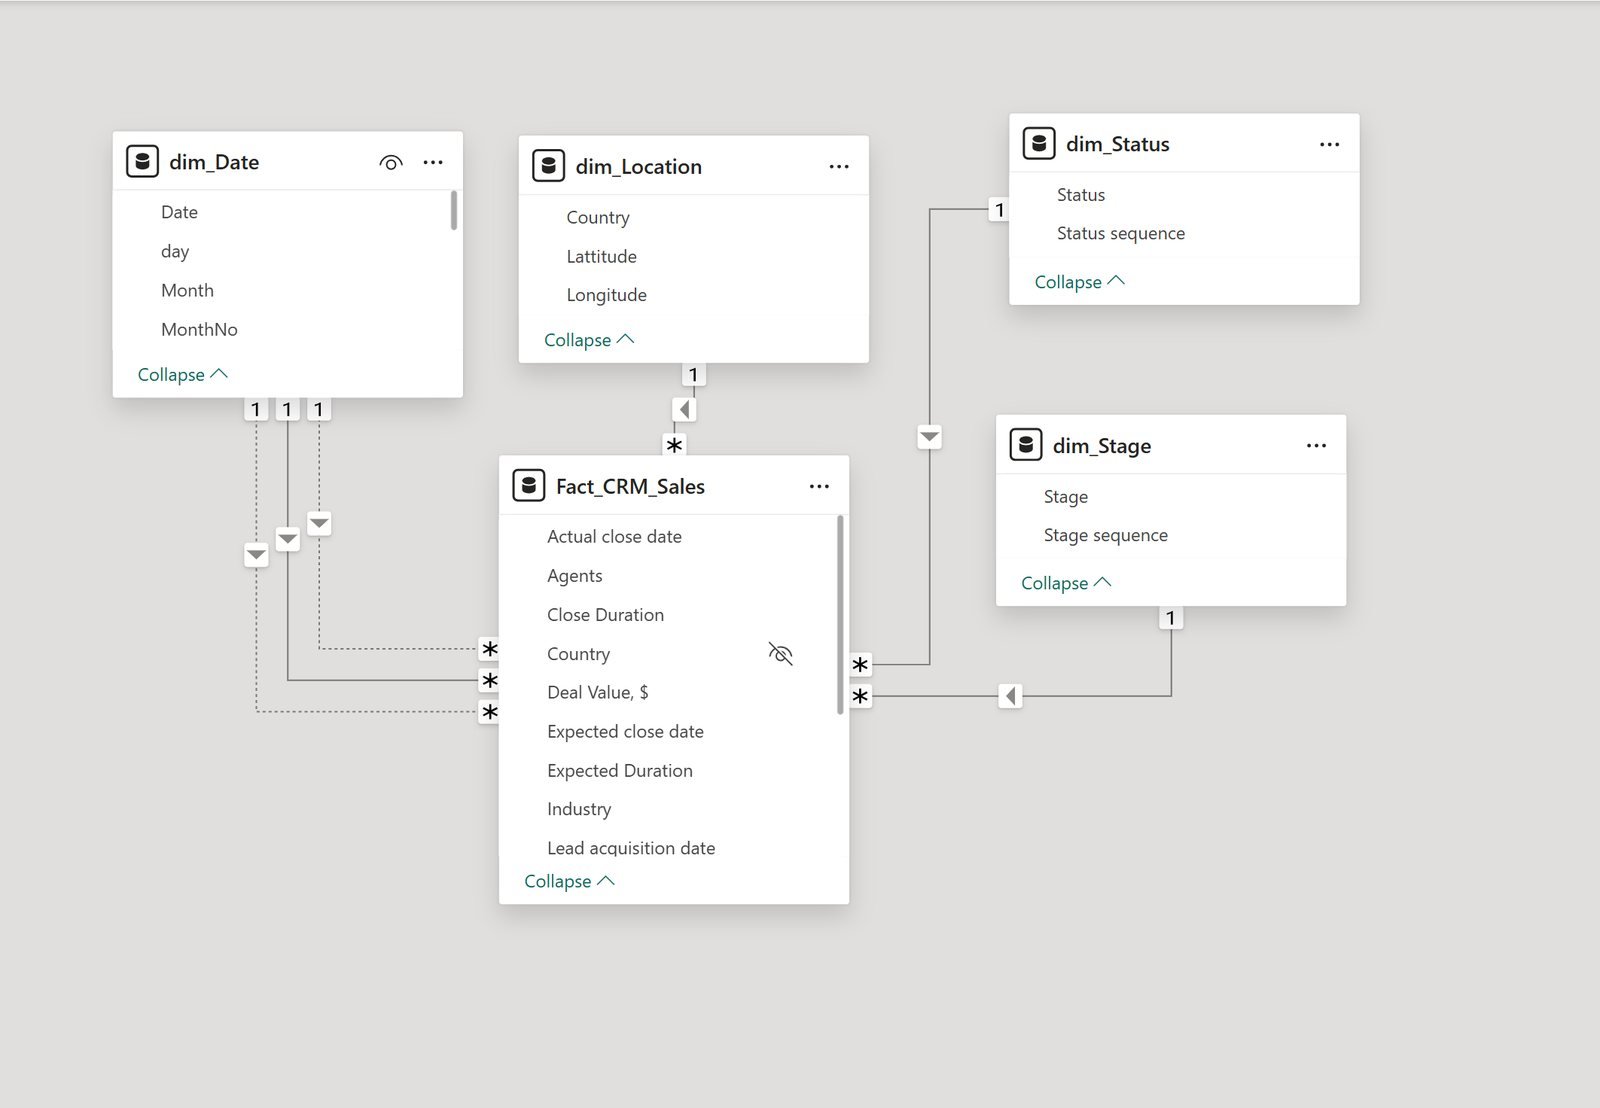
A growing sales organization was sitting on thousands of leads but had no real visibility into their own pipeline. Leadership couldn't answer basic qu…
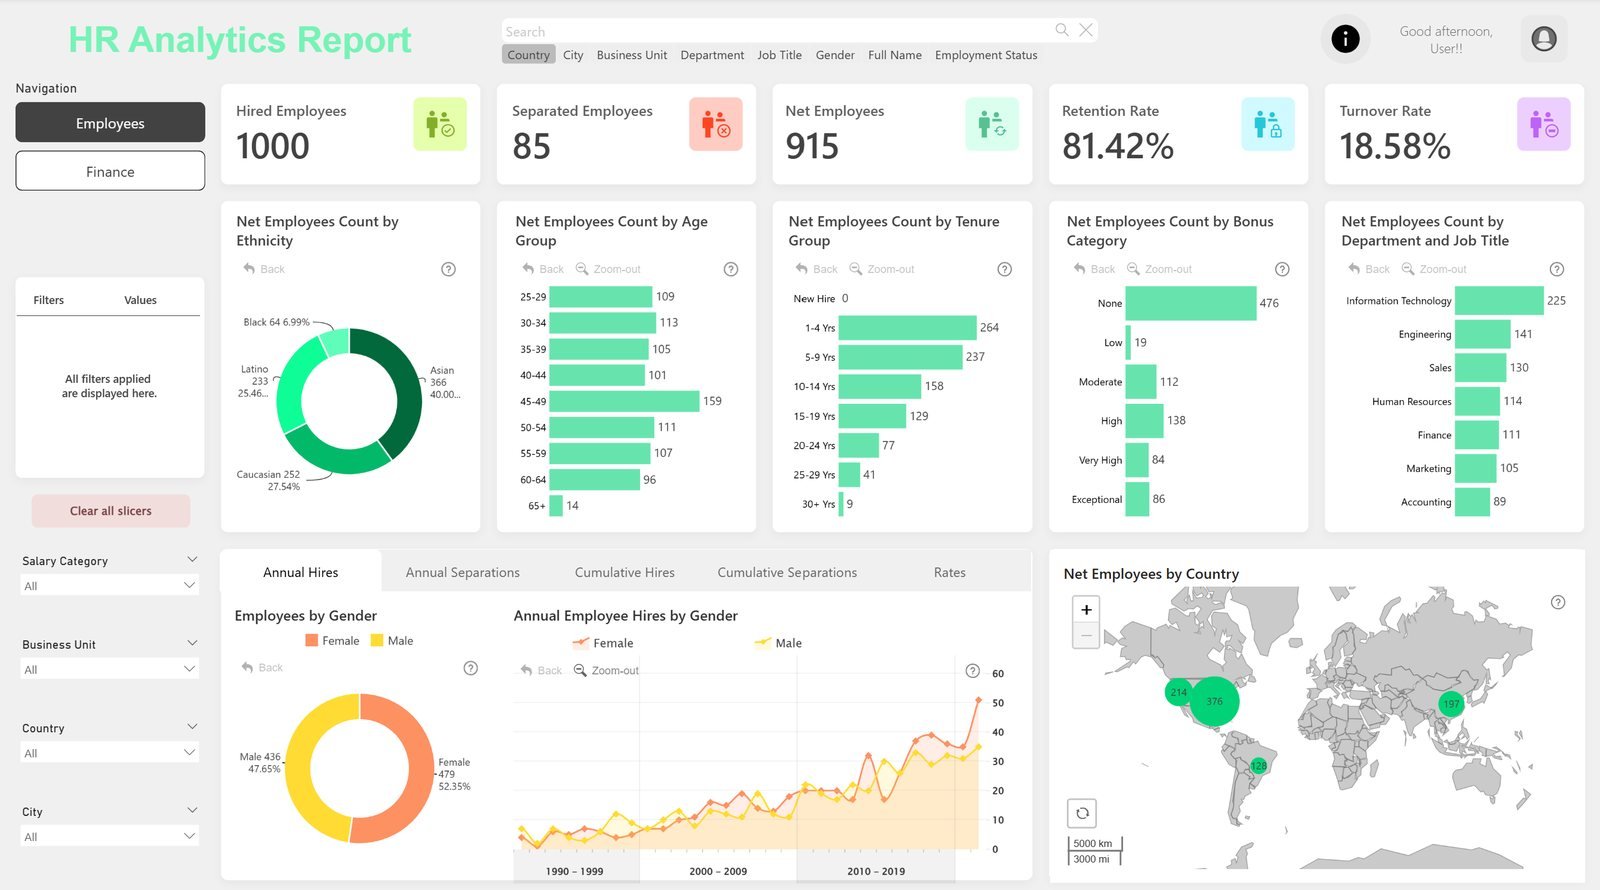
An organization had no consolidated way to monitor workforce composition, retention, or pay equity across departments and business units. HR could see…
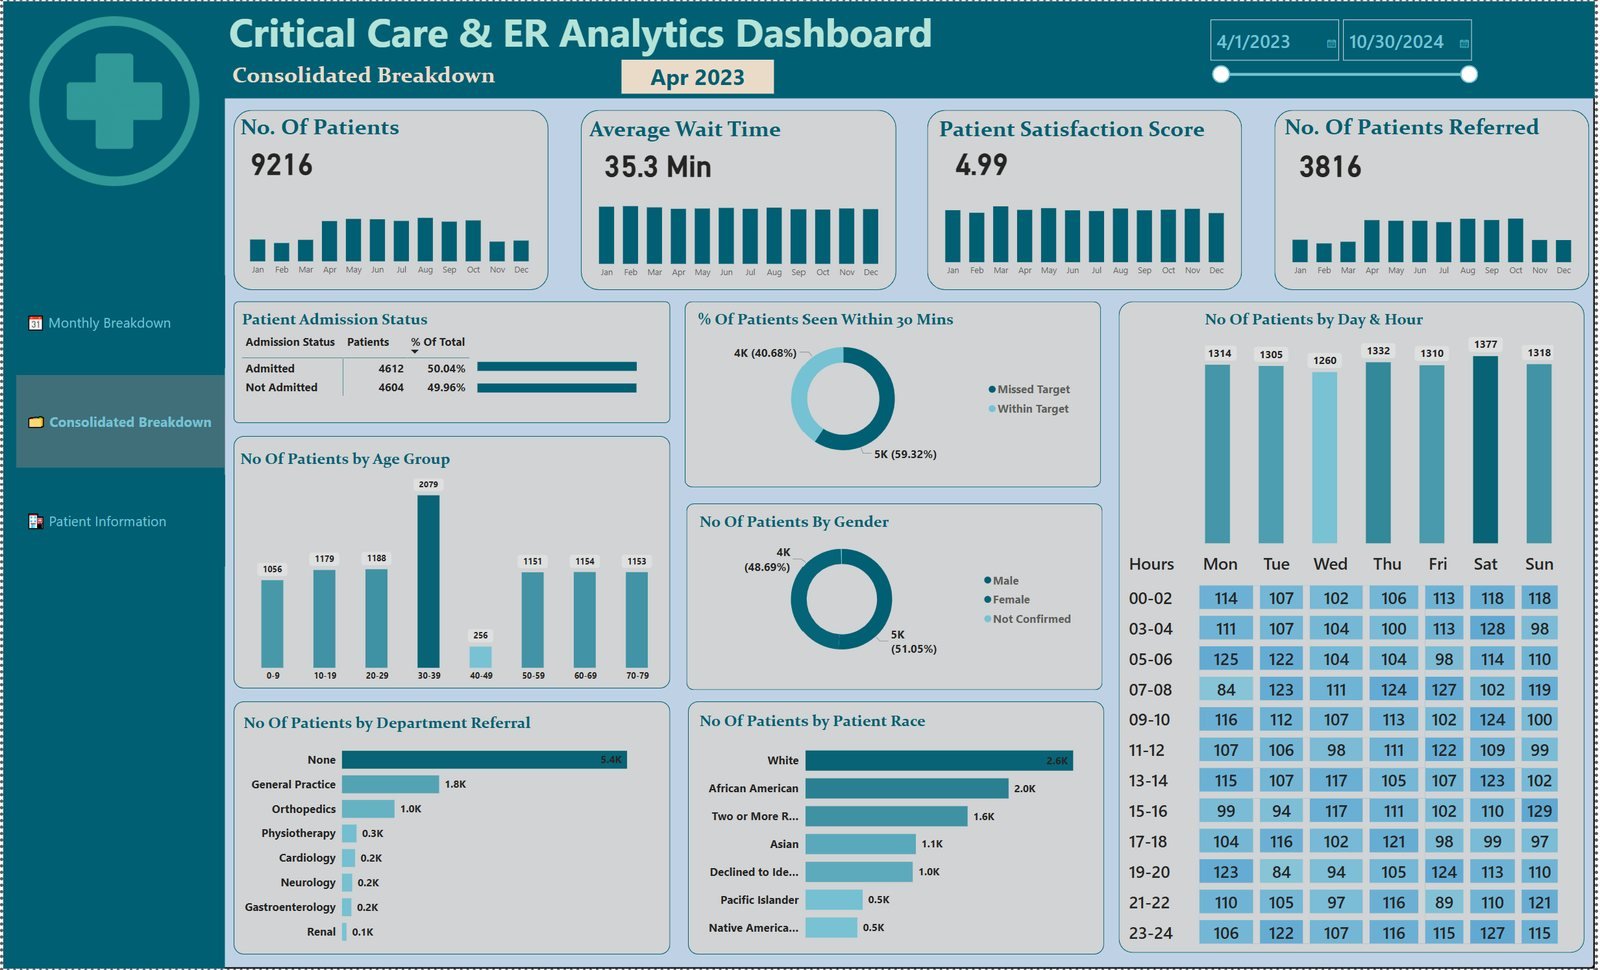
An emergency department had no consolidated way to monitor patient flow, wait times, or admission patterns across time. Staff could see daily activity…
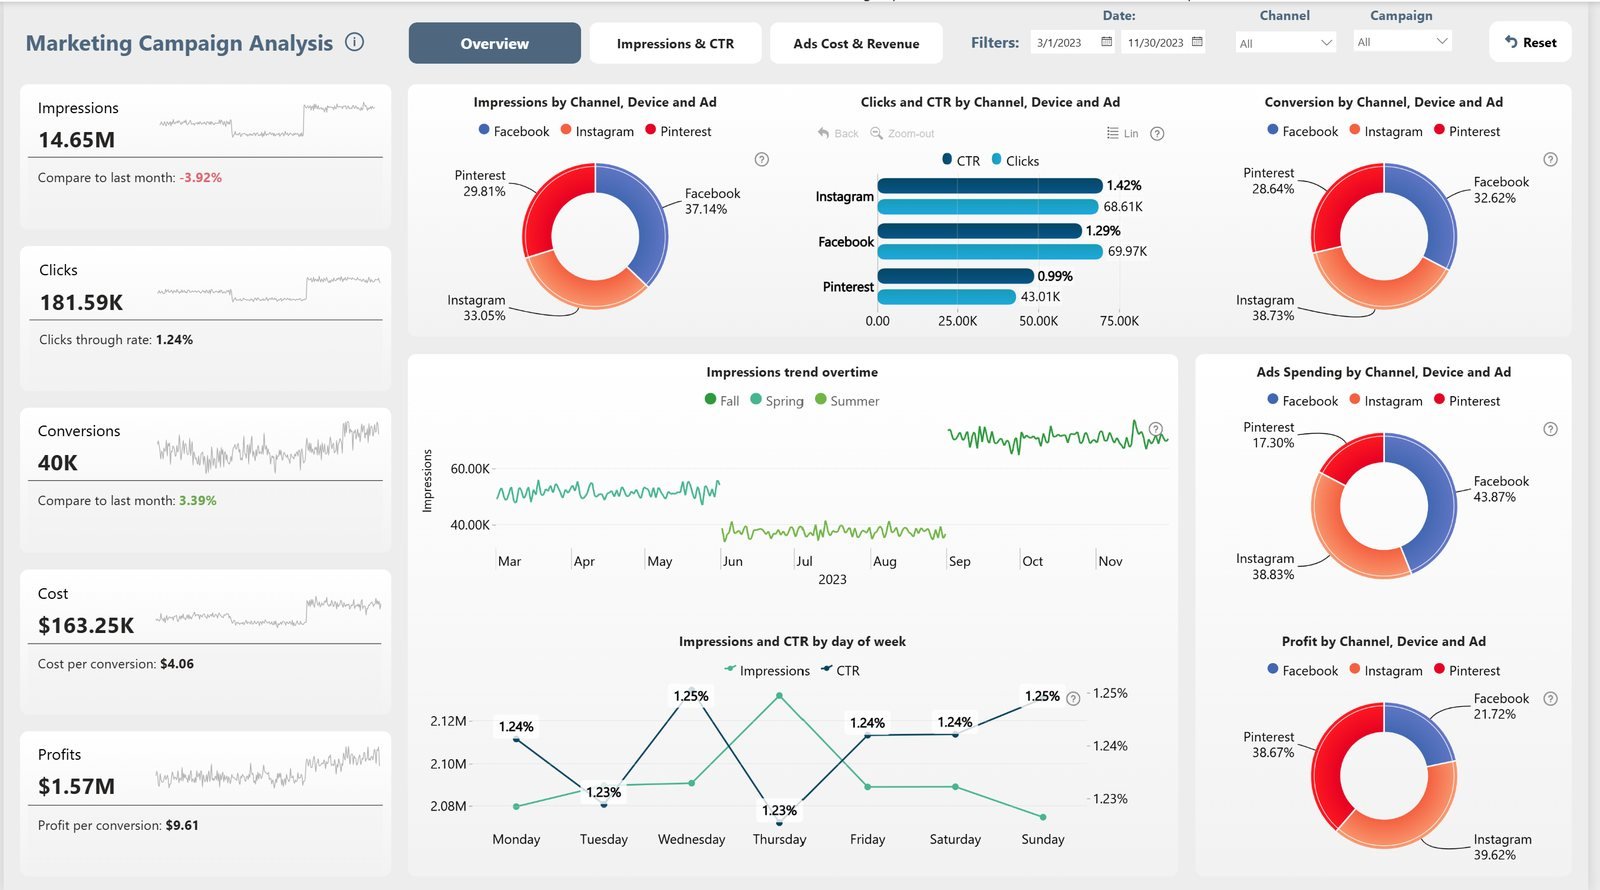
A business running paid campaigns across Facebook, Instagram, and Pinterest had no unified way to compare performance across channels. Each platform's…
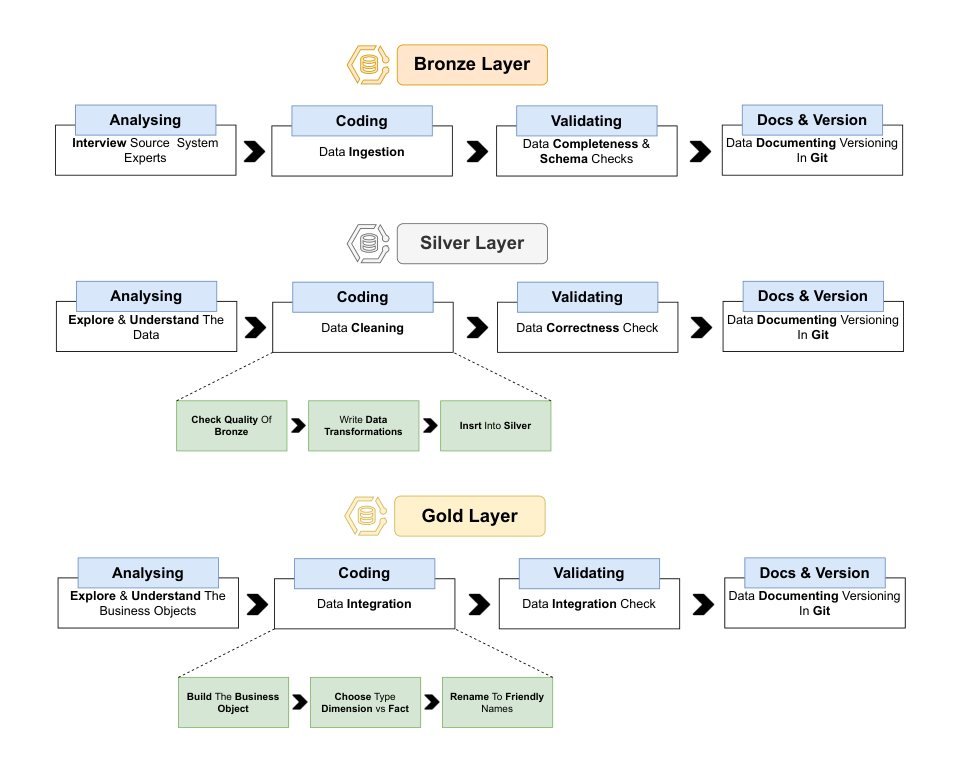
An organization running separate CRM and ERP systems had no unified, trustworthy data layer to build analysis on top of. Each system held its own vers…
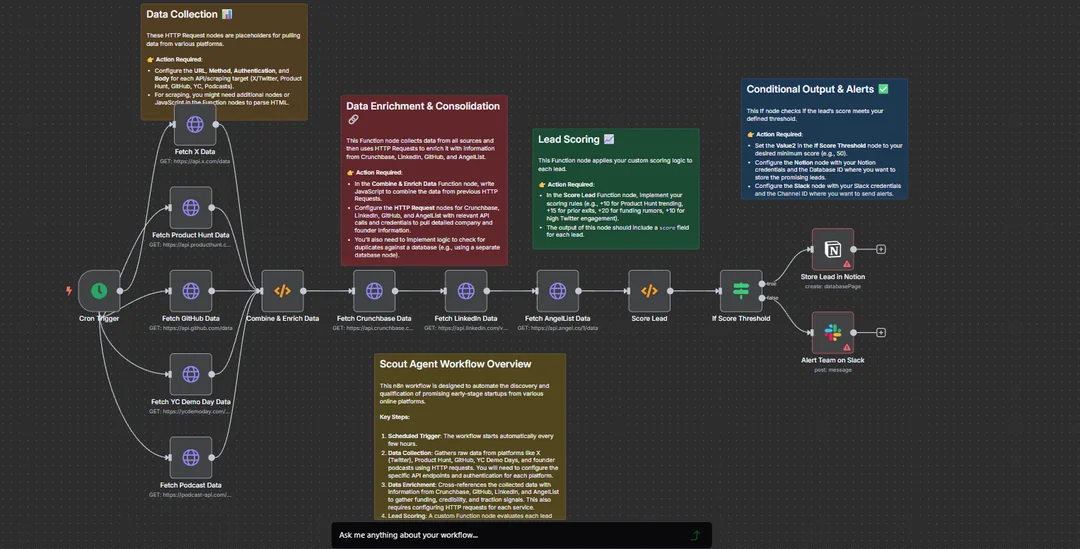
VC teams and scouts rely on manual research to find promising early-stage startups. It is slow, it does not scale across sources, and it is easy to mi…
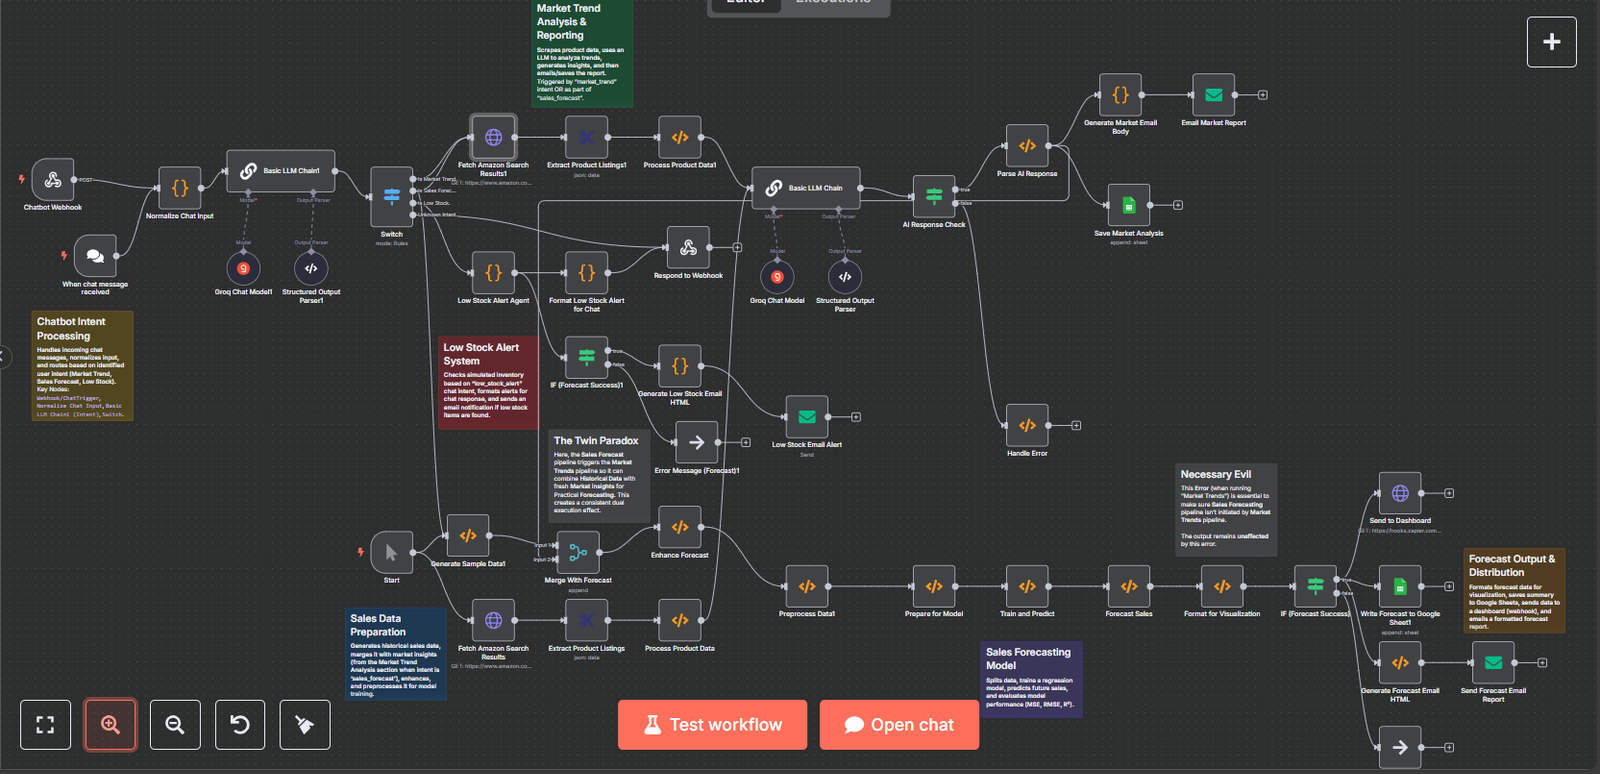
A sales team needed market insights, demand forecasting and stock alerts, but every one of those depended on somebody sitting down to build a report…
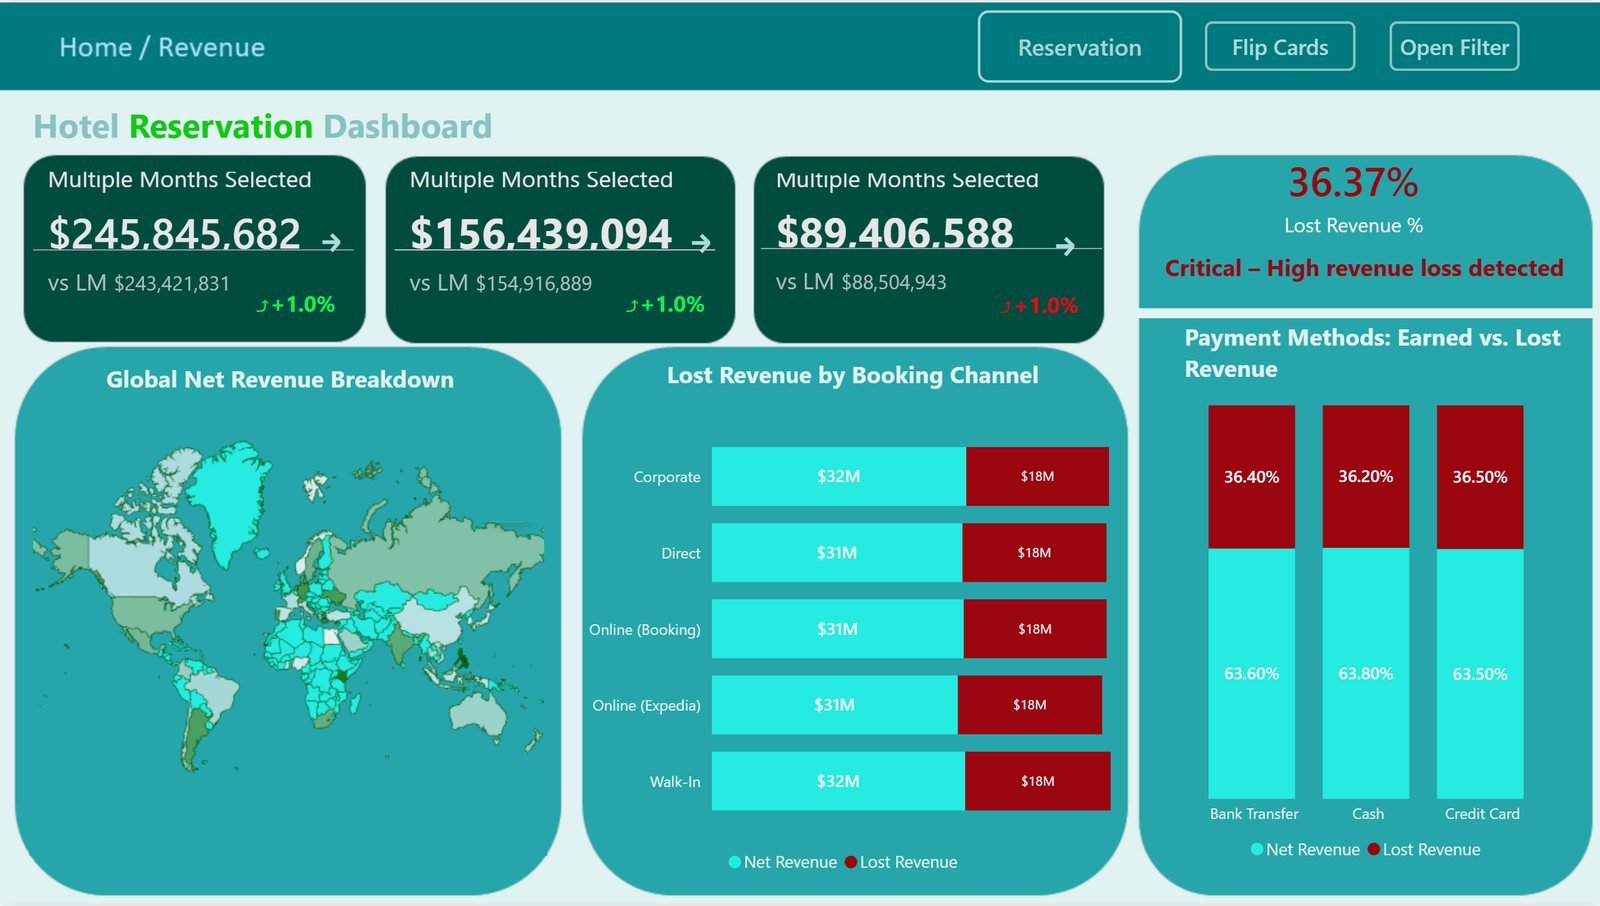
A hotel operation was taking reservations across multiple channels, corporate accounts, direct bookings, walk-ins, and third-party platforms like Book…
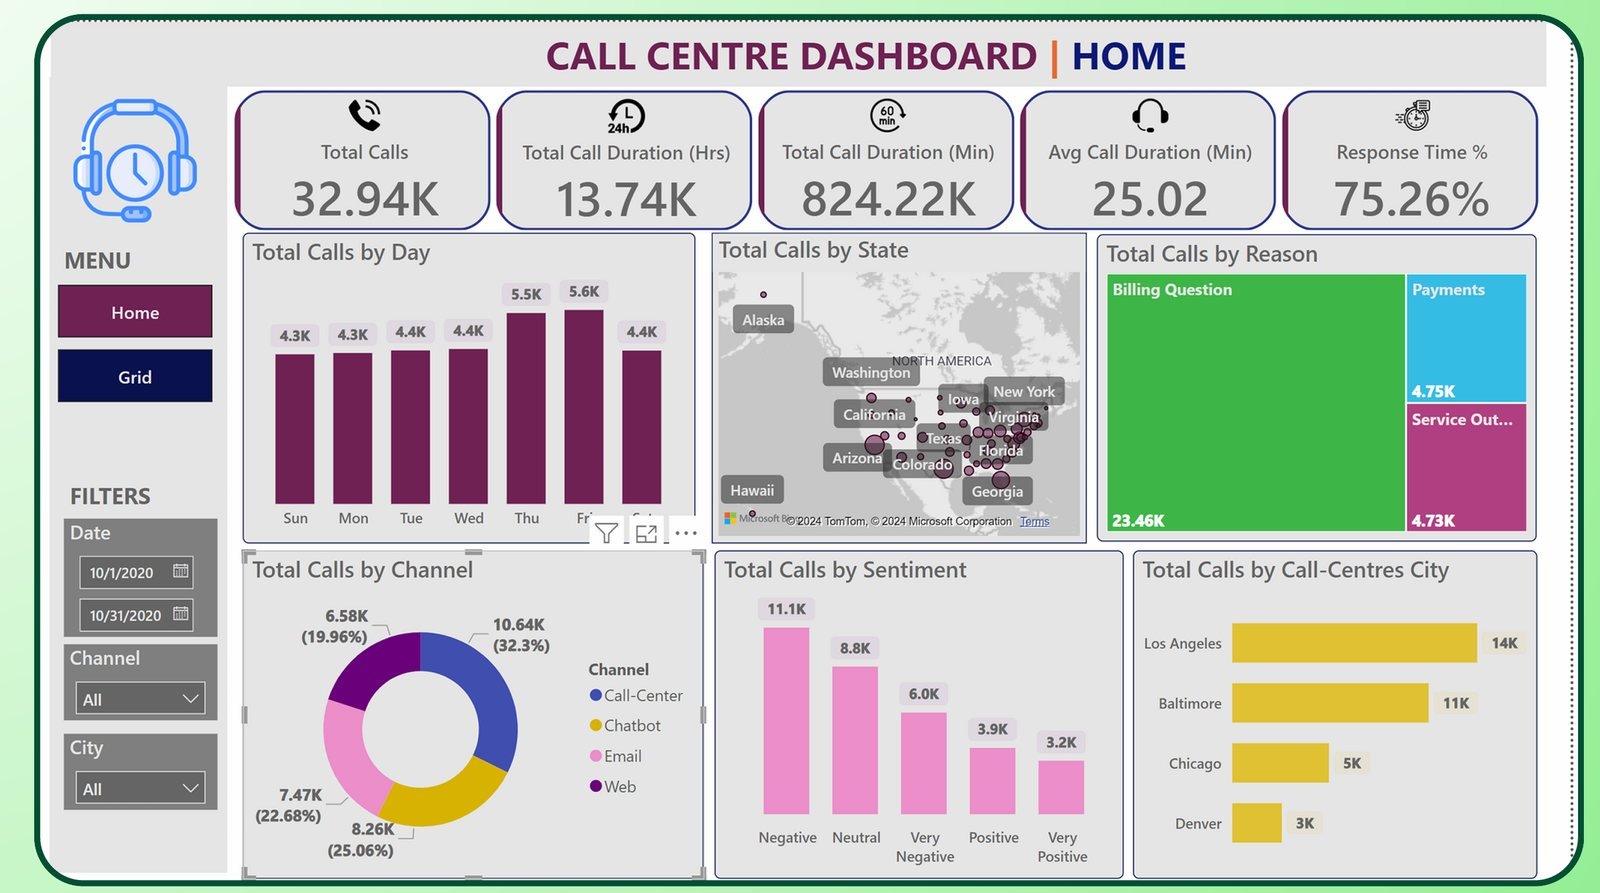
A multi-channel call centre operation (spanning Call-Center, Chatbot, Email, and Web) had no way to see customer sentiment at scale across its interac…
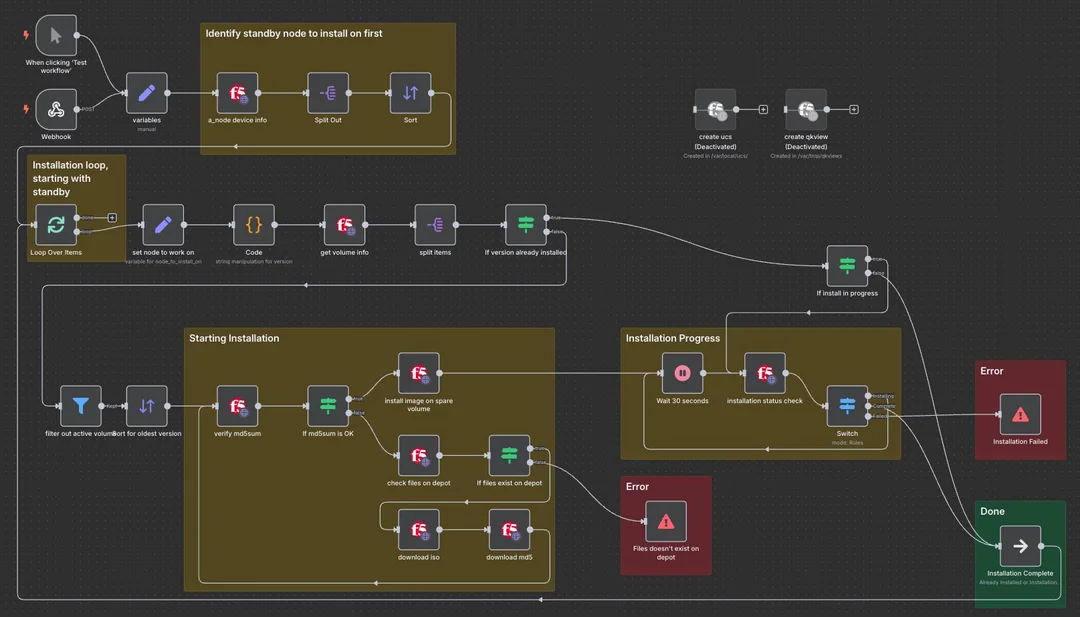
Installing software images on F5 Big-IP devices was a manual, repetitive job taking 15 to 20 minutes of hands-on attention per run. It is exactly the…
The stack I work in day to day, from source system through to the report a stakeholder opens.
Upwork (Freelance) · Remote Freelance
Code Prisma · Islamabad, Pakistan Full-time
Research and analytical writing background that carries directly into documenting data models and explaining findings to non-technical stakeholders.
Trained in structured argument and evidence — the same discipline a defensible dashboard metric needs.
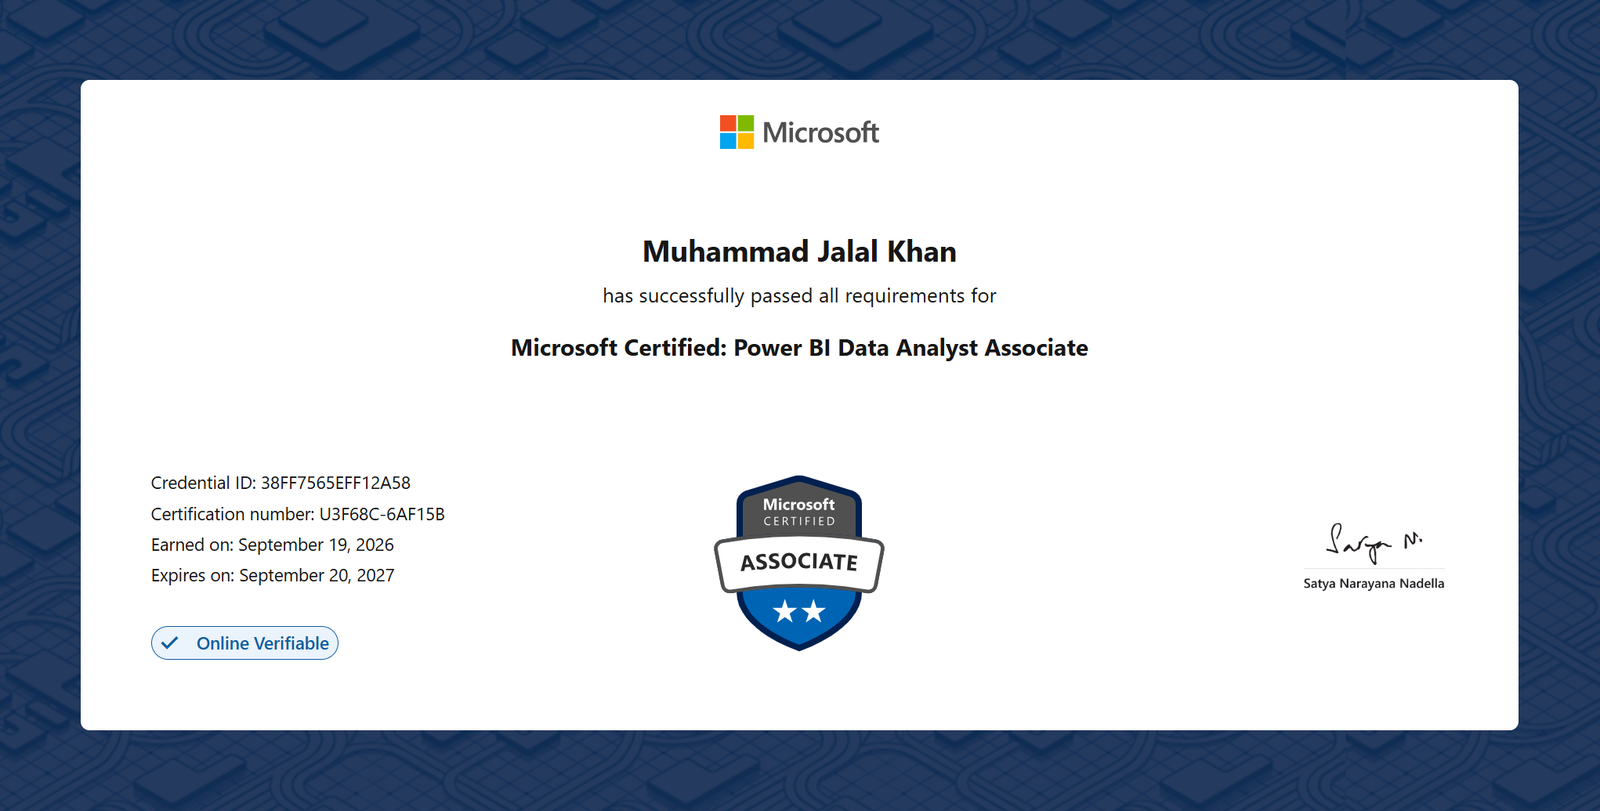
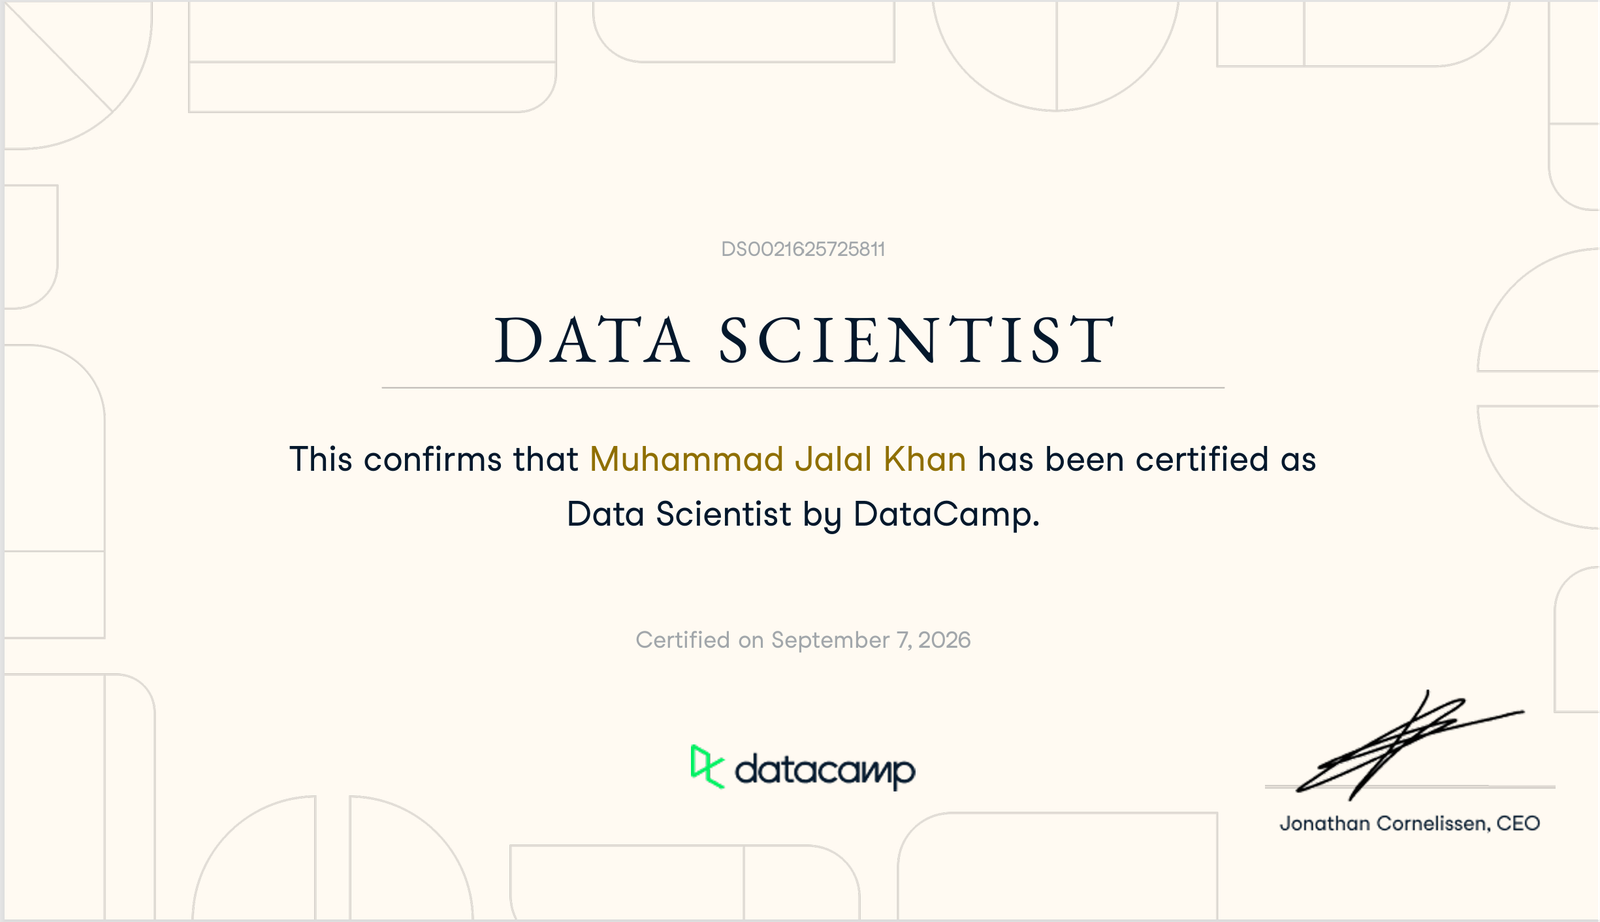
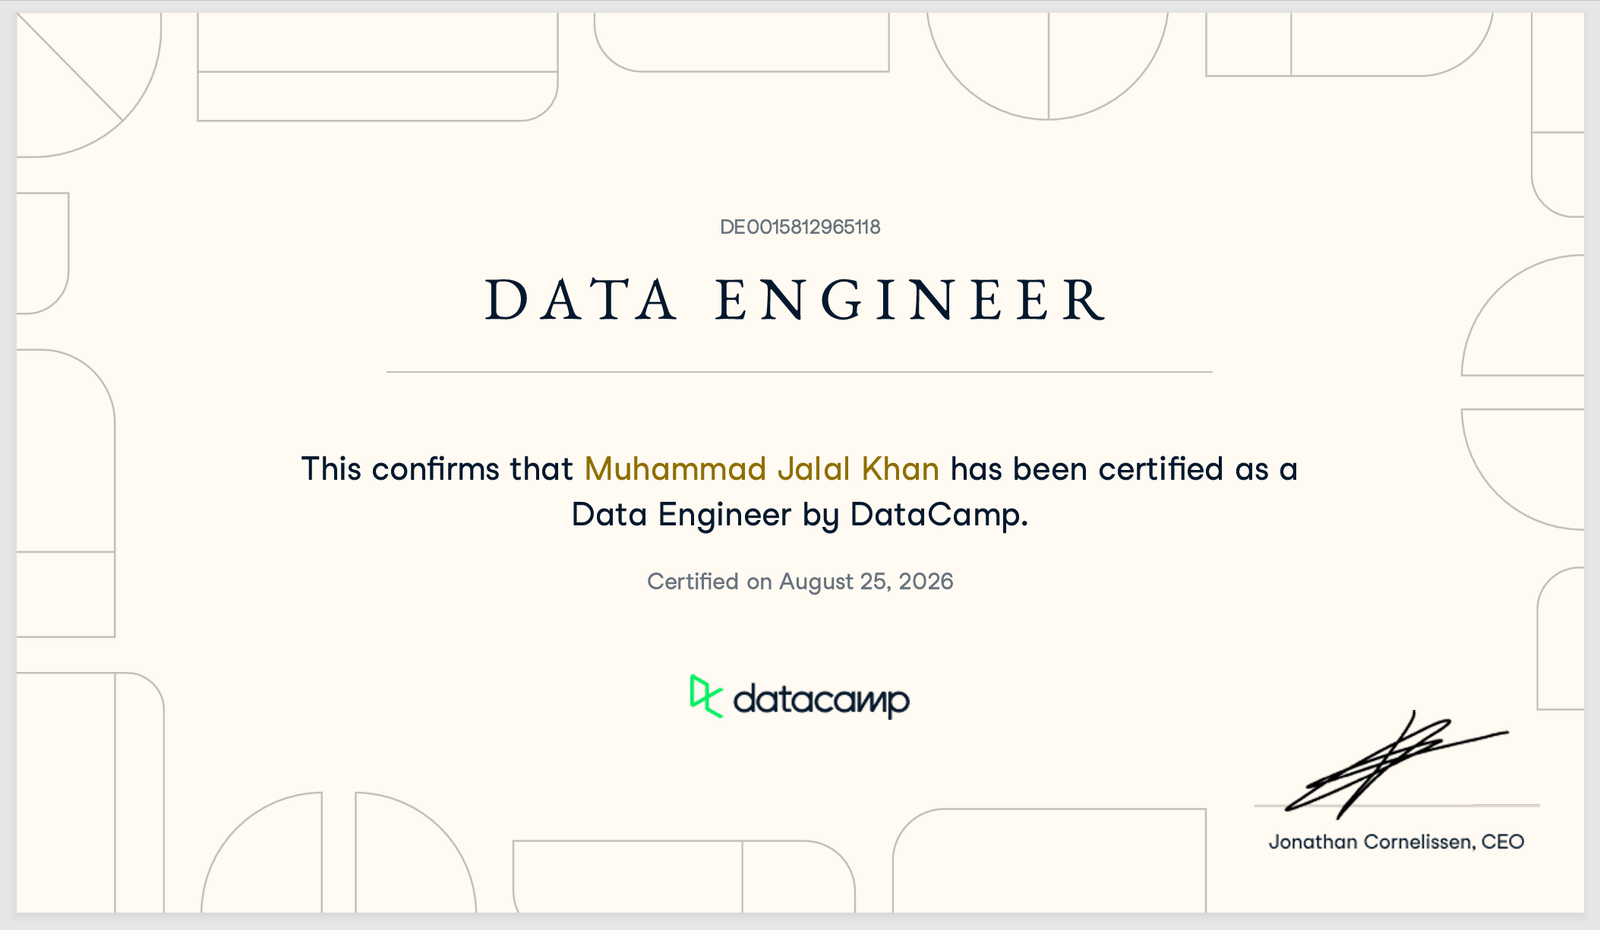
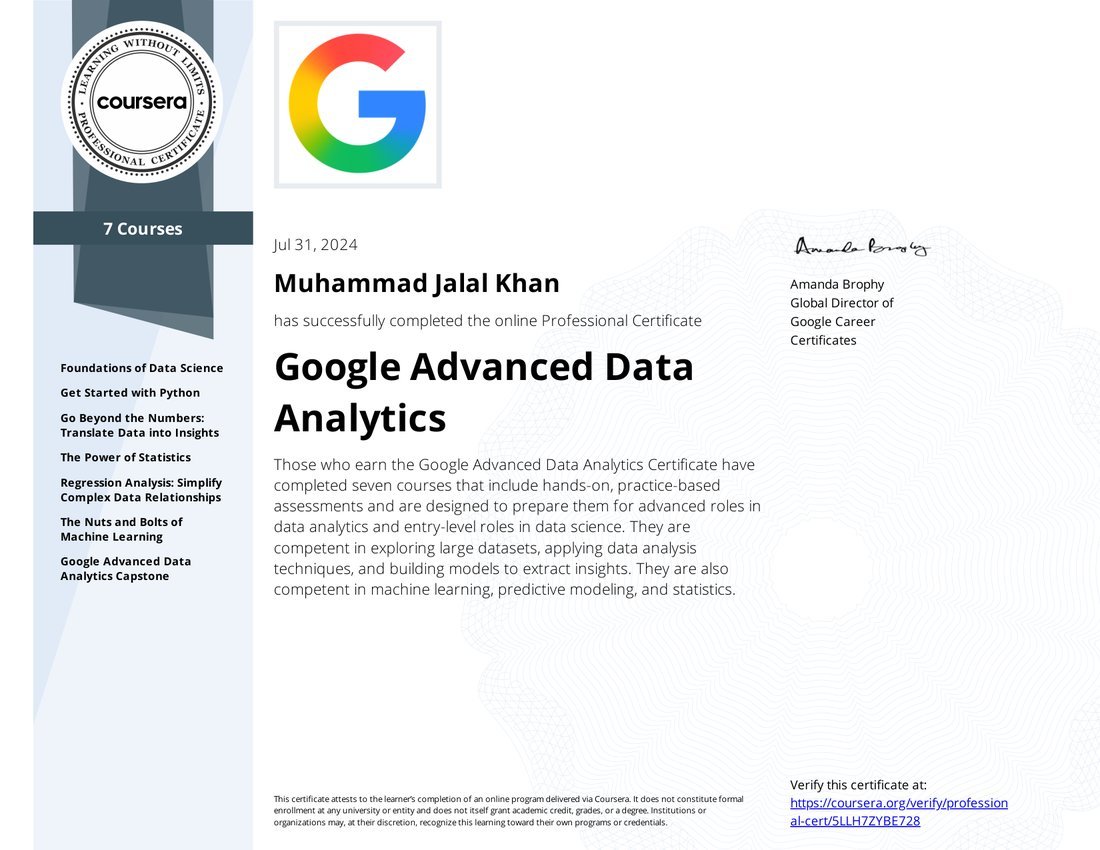
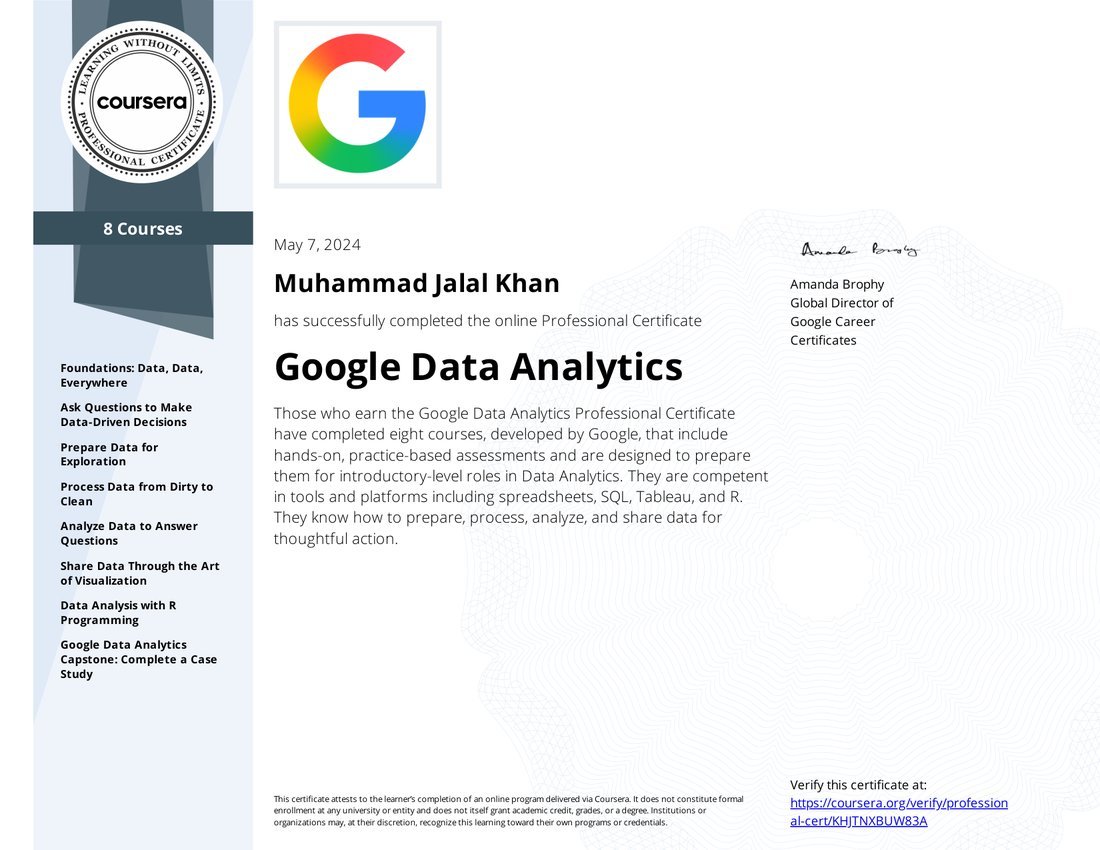
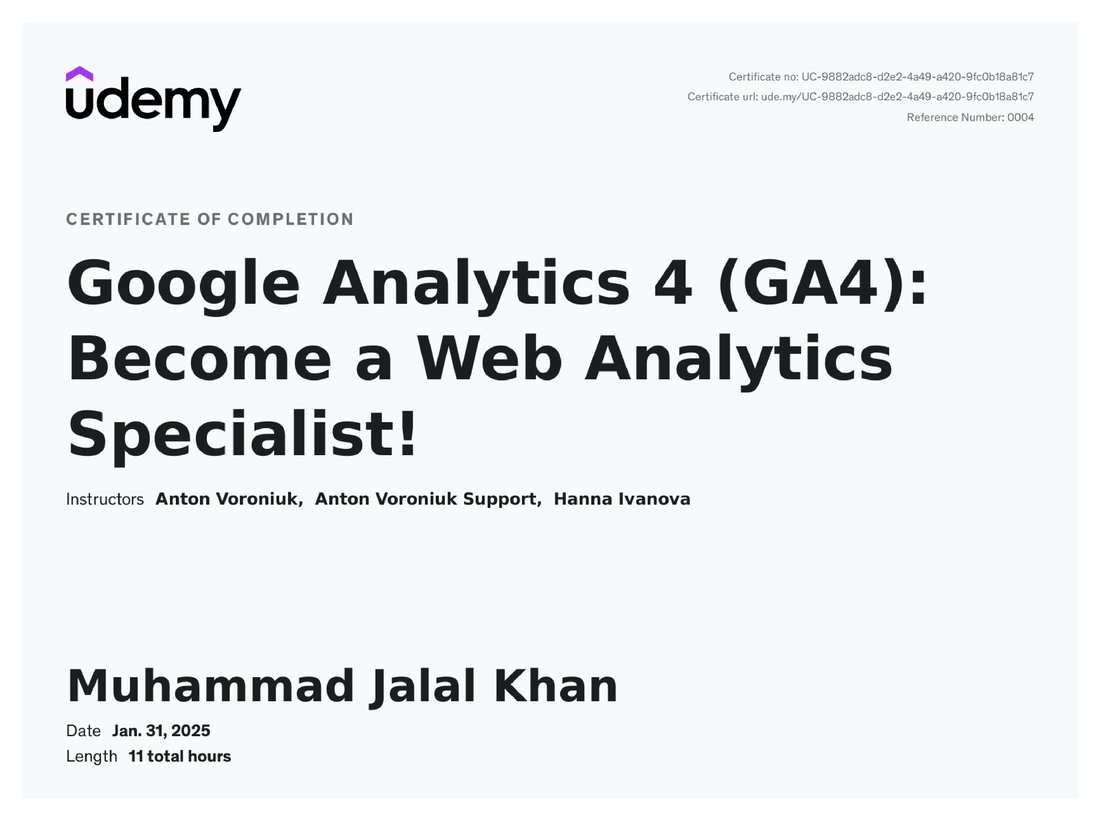
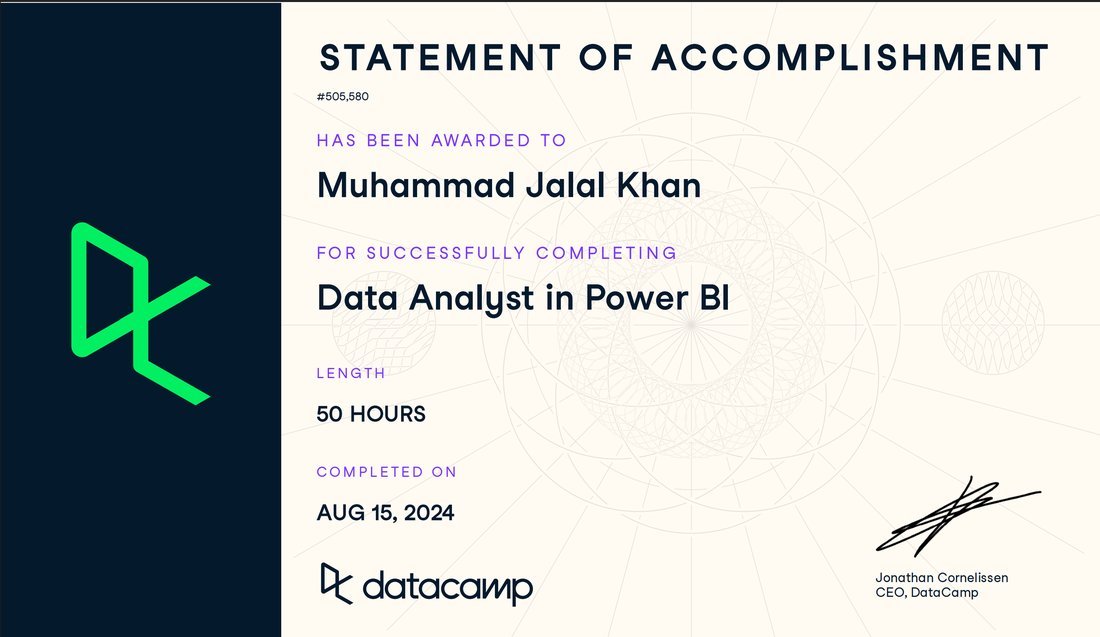
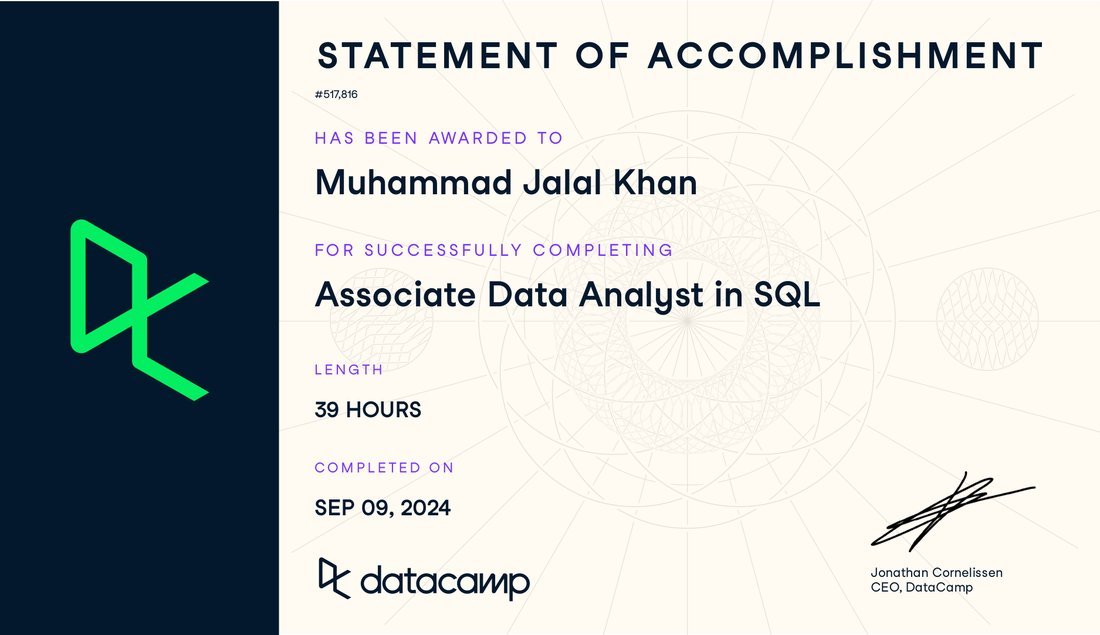
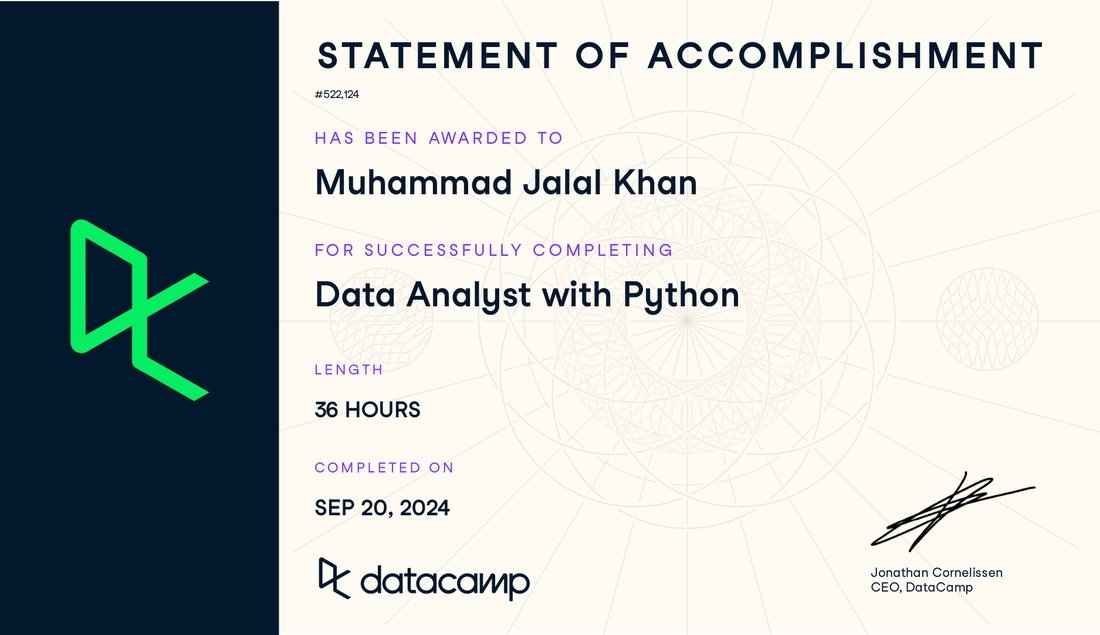
Every certificate below is verifiable — click through to the issuer.


Tell me what you are trying to measure and what is getting in the way. I reply within one business day.