HR Analytics & Workforce Report
Microsoft Fabric | Power BI Development | Workforce & Compensation Analytics
01The challenge
An organization had no consolidated way to monitor workforce composition, retention, or pay equity across departments and business units. HR could see headcount changes reactively, but had no structured view of turnover trends, no visibility into whether compensation was equitable across gender, age, or ethnicity, and no way for department heads to self-serve basic workforce questions without going back to HR for a manual pull.
02The data problem
Core employee data lived in the organization's HR system, but individual departments maintained their own supplementary records separately in Excel and CSV files, headcount notes, role classifications, or local tracking that never made it back into the central system. This meant no single source could answer department-level questions accurately, there was no consistent tenure or bonus-category classification across records, and salary data had never been broken down in a way that could actually surface pay gaps.
03My approach
I built a Data Factory pipeline in Microsoft Fabric to pull core employee data from the HR system while also ingesting the separate department-maintained Excel and CSV files, landing everything in a Fabric Lakehouse as a unified staging layer rather than treating the department files as one-off manual additions. From there, I used Dataflows Gen2 and SQL in the Fabric Warehouse to reconcile the two, matching employee records across sources, resolving inconsistent job title and department naming, and building out standardized classification fields for tenure group, age group, and bonus category that didn't exist in the source data.
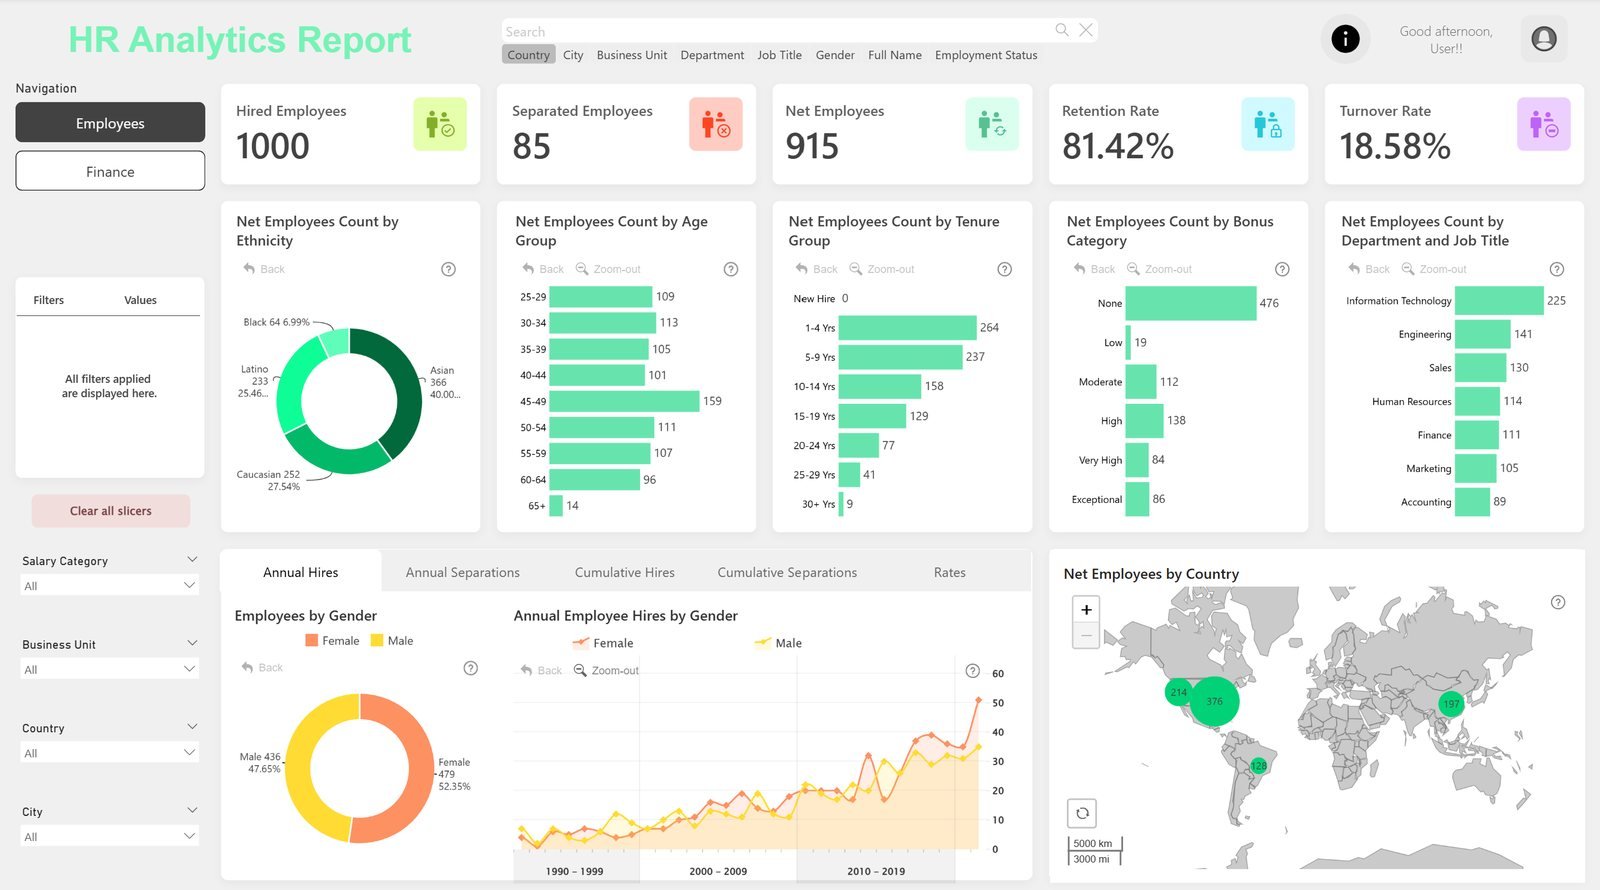
Once the model was unified, I connected Power BI to the Fabric Warehouse and built two focused views around how HR actually operates day to day: an Employees page tracking headcount movement, hires, separations, retention rate, and turnover rate, with drill-down breakdowns by ethnicity, age group, tenure, department, and job title, alongside a global map showing workforce distribution by country, and a Finance page built specifically around compensation equity, average salary broken out by ethnicity, department, age group, and tenure group, each split by gender so pay differences are visible immediately rather than buried in an aggregate number.
The most technically involved piece was the Gender Pay Gap trend visual, a year-by-year comparative view built with DAX measures calculating average male versus female salary across two decades of hire data, letting HR see not just the current gap but whether it's been narrowing or widening over time. I also built a job-title-level salary comparison table with conditional formatting flagging which gender earned more in each role, since aggregate department averages alone can hide role-level disparities.
04The result
The dashboard gave HR and leadership a live, self-service view of workforce health for the first time. It surfaced an 18.58% overall turnover rate against an 81.42% retention rate, giving a clear baseline to track against going forward, and the pay equity analysis revealed that male employees held a higher average salary overall ($114K vs. $112K), with the gap reversing in specific roles like Sr. Manager and Controls Engineer, where female average pay was actually higher, a level of detail that would have been completely invisible in a single company-wide average.
Tools & tech stack
- Microsoft Fabric Data Factory: used to build a pipeline pulling employee data from the core HR system alongside department-maintained Excel/CSV records
- Fabric Lakehouse: staging layer unifying HR system data with department-level supplementary files
- Dataflows Gen2 & T-SQL (Fabric Warehouse): used to reconcile records across sources and build standardized tenure, age, and bonus classification fields
- Power BI Desktop & DAX: used to build retention/turnover calculations, the multi-year gender pay gap trend analysis, and role-level salary comparison logic
- Conditional Formatting: applied to job-title salary tables to flag gender pay differences by role
- Geospatial Visualization: map view for global workforce distribution by country
Have data that isn't telling you anything yet?
Send me what you are working with — even if it is four spreadsheets and a CRM export that don't agree with each other.