Financial Analysis Dashboard
Microsoft Fabric | End-to-End ETL Pipeline | Financial Reporting & Ratio Analysis
01The challenge
A multi-line consumer goods business (spanning sports equipment, sportswear, and nutrition supplements) had no consolidated way to see how the company was actually performing. Finance was rebuilding P&L summaries manually every month, ratios were calculated inconsistently, and nobody outside the finance team could self-serve an answer to something as basic as "what's driving our margin this quarter."
02The data problem
The financial data lived across the client's internal servers, with each business line maintaining its own records independently, each with different formatting, column naming, and level of detail. There was no shared chart of accounts, no separation between COGS, operating expenses, and interest/tax, and no calculated ratios or trend logic anywhere. Before any real analysis could happen, this data needed to be extracted, cleaned at the source, and rebuilt into one consistent model.
03My approach
I built a Data Factory pipeline within Microsoft Fabric to pull the business-line records off the client's servers on a scheduled basis, landing the raw files in a Fabric Lakehouse as a central staging point. From there, I used Dataflows Gen2 and T-SQL in the Fabric Warehouse to do the real structuring work: standardizing inconsistent column naming and formats across business lines, resolving categories that were labeled differently across sources, and mapping every transaction to a consistent chart of accounts, COGS, Opex, and Interest and Tax, along with subcategories like Labor, Materials, Shipping, and Marketing.
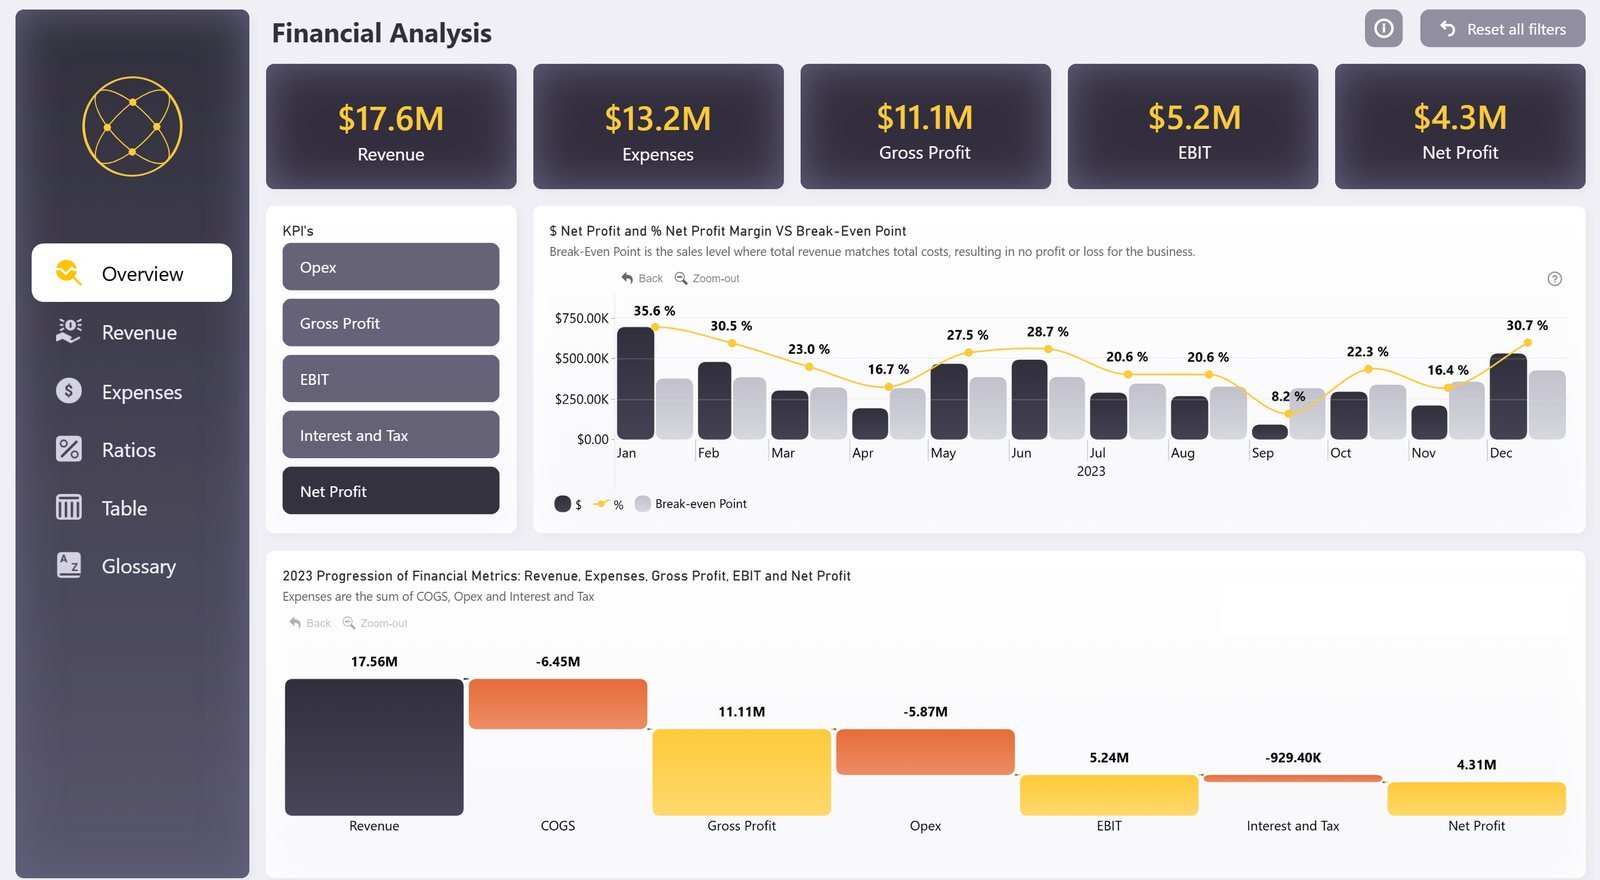
With clean, structured tables sitting in the Fabric Warehouse, I built the semantic model directly on top: category and business-line dimension tables linked to the transaction fact table, with a drill-down hierarchy from category down to subcategory. Power BI connected natively to the Warehouse for reporting, where I built a full DAX layer calculating Gross Profit, EBIT, Net Profit, and their respective margins, along with a dynamic Opex ratio and month over month percentage change measures that update automatically as new data lands through the pipeline.
I also modeled a break-even point calculation against actual net profit, giving leadership a direct visual read on how close the business was running to its break-even threshold each month. The report was structured around how different users actually work: an Overview page for a fast executive read, dedicated Revenue and Expenses pages for category level drill down, a Ratios page for trend tracking, a raw Table page for finance to audit exact figures, and a Glossary page so non-finance stakeholders could understand exactly how each metric was calculated.
04The result
Leadership got a live financial reporting tool that replaced the manual monthly rebuild entirely, refreshing automatically end to end from source servers to report. The dashboard surfaced that Opex ratio spiked to 41.2% in September against a yearly average in the low 30s, a swing that would have taken real digging to catch across disconnected records. It also gave non-finance stakeholders a self-serve way to understand margin performance, cutting down on back and forth requests to the finance team.
Tools & tech stack
- Microsoft Fabric Data Factory: used to build a scheduled pipeline extracting business-line records directly from the client's servers
- Fabric Lakehouse: used as the staging layer for raw data before transformation
- Dataflows Gen2 & T-SQL (Fabric Warehouse): used to standardize formatting and map scattered business-line data into a consistent chart of accounts
- Fabric Data Warehouse: hosted the modeled star schema (fact table linked to category and business-line dimensions)
- Power BI (Fabric-native): used to build the semantic model, DAX financial metric calculations, ratio tracking, and break-even modeling
- Data Structure: star schema with drill-down hierarchy (Category > Subcategory)
- Documentation: in-report glossary page for non-finance stakeholder self-service
Have data that isn't telling you anything yet?
Send me what you are working with — even if it is four spreadsheets and a CRM export that don't agree with each other.